Case study · Deep dive · Reporting
A dashboard people actually open on Monday
By brand, by city, by salesperson, with CRM leads next to the spend: the MyDigipal dashboard seen from the inside, and what it changed in two groups' meetings.
The MyDigipal dashboard at Guyane Automobile (eight pages) and Théobald Group (three views)
What gets in the way
Ten exports, one spreadsheet, one lost Monday
Ten exports, five platforms, a spreadsheet glued together by hand every month. Or a single screen, updated every morning.
A multi-brand group does not read its numbers the way an ad platform does. It wants to see each brand, each city, each salesperson, and what became of the leads in the CRM.
At Guyane Automobile
Eight pages, one version of the truth
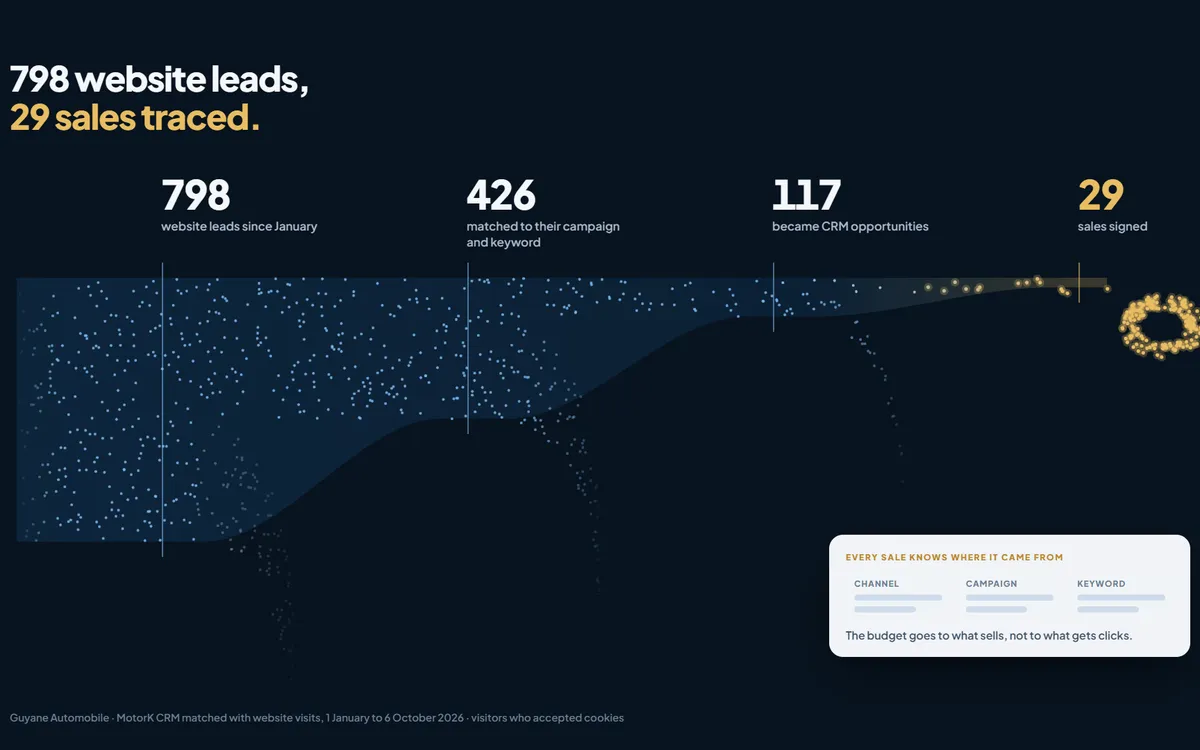
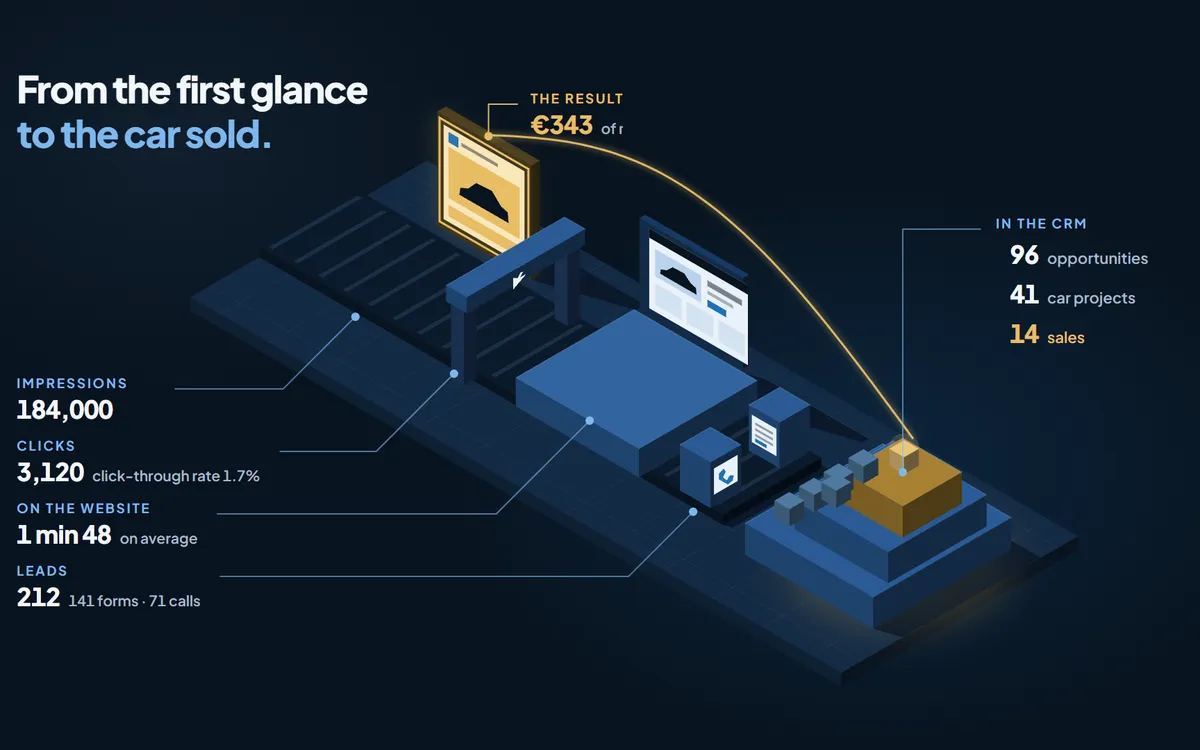
CRM leads sit next to the spend: the team sees what each brand cost, and what it sold.
Spend, leads and sales for the week.
Meta and Google, campaign by campaign.
Each brand, its leads and their cost.
What became of the leads, and the sale at the end.
Who called back, who sold.
A question in plain words, an answer with the group's numbers.
At Théobald Group
The group, the brand, the city
Ten brands across three countries: the monthly review relies on three views, and every budget decision starts from a precise city or brand.
« The dashboard has become our Monday meeting: each brand sees its leads, its sales and what they cost. »
Checklist
What a dealership dashboard must show
Six views, in this order, so a fifteen-minute meeting is enough.
- The week at a glance
Spend, leads, sales: three numbers and their trend.
- By brand
Each brand with its budget, its leads and their cost.
- By city or dealership
Where the budget works, and where it sleeps.
- Leads that became sales
The link with the CRM: opportunities, sales, cost per sale.
- The sales staff
Call back time and sales for each person.
- Numbers you can trust
A lead counted once, sources checked every month.
Frequently asked questions
Dashboard: what we get asked
Where do the numbers come from?
From the ad platforms, the website and the CRM, brought together every night. Nothing is typed in by hand.
Who has access?
Management, marketing and, if you wish, dealership managers, each with what concerns them.
Can you ask it questions?
Yes. At Guyane Automobile, an assistant answers with the group's numbers: by brand, by period, by source.
Other case studies

What would it look like for your dealerships?
The calculator prices your campaigns in two minutes. Or write to us: we reply within 24 hours.