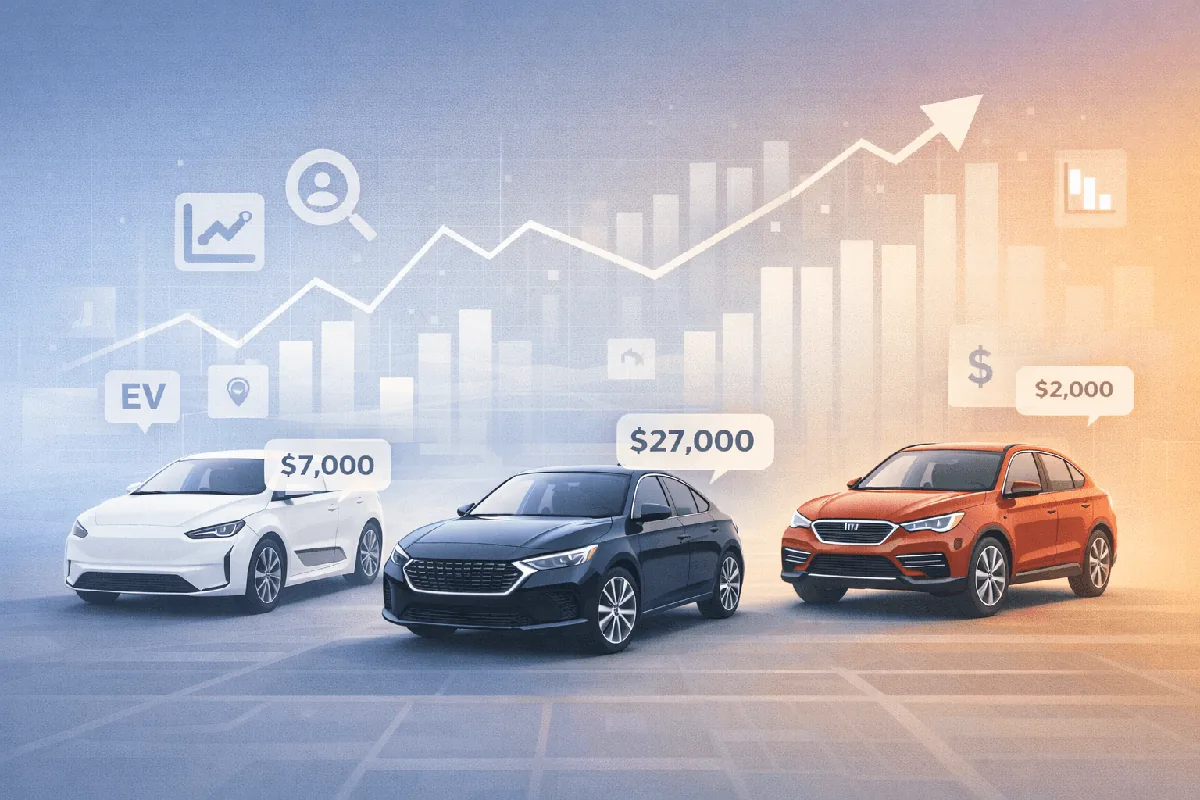
The European used car market is undergoing its most significant transformation in decades. With new car prices rising 15% faster than used values, supply chain disruptions reshaping inventory, and electric vehicles creating unprecedented depreciation patterns, dealerships must adapt or risk obsolescence.
According to Autovista Group, used-car transactions across Spain, Italy, the UK, Germany, and France all saw growth, outperforming their respective new-car markets.
This guide analyzes the key trends shaping the used car landscape in 2026 and provides actionable strategies for dealerships.
2026 European used car market overview
| Country | Transaction Growth | Market Value | Key Trend |
|---|
| France | +0.8% YoY | €75.65 billion | Strong demand for 10+ year vehicles |
| Germany | +1.2% YoY | €89.3 billion | Premium brand resilience |
| UK | +2.1% YoY | £52.4 billion | Online sales acceleration |
| Spain | +3.4% YoY | €28.7 billion | Economic recovery driving demand |
| Italy | +1.8% YoY | €31.2 billion | Small car popularity |
France: second-largest european market
France has emerged as Europe’s second-largest pre-owned vehicle market, trailing only Germany. Key statistics:
| Metric | Value |
|---|
| 2026 Market Value | €75.65 billion |
| Projected 2030 Value | €131.78 billion |
| CAGR (2026-2030) | 11.74% |
| Q1-Q3 Transactions | 4,036,917 |
The French market shows particular strength in vehicles over 10 years old, with transactions in this age group up 11%—partially compensating for the shortage of younger used cars caused by years of new-car market struggles.
Consumer behavior shifts
Why buyers are choosing used
| Factor | Impact | Trend Direction |
|---|
| New car price inflation | +15% vs used car prices | Accelerating |
| Economic uncertainty | Budget-conscious buying | Stable |
| Supply chain recovery | More inventory available | Improving |
| Subscription fatigue | Preference for ownership | Declining subscriptions |
| Environmental awareness | Extending vehicle life | Growing |
Demographic purchasing patterns
| Segment | Preference | Budget Range | Key Motivator |
|---|
| Gen Z (18-25) | Small EVs, hybrids | €8,000-15,000 | Sustainability |
| Millennials (26-41) | SUVs, crossovers | €15,000-30,000 | Family practicality |
| Gen X (42-57) | Premium brands | €25,000-50,000 | Status + reliability |
| Boomers (58+) | Familiar brands | €20,000-40,000 | Comfort + safety |
The ownership vs. subscription debate
| Model | Trend 2026 | Consumer Sentiment |
|---|
| Traditional ownership | Growing | Preferred for value |
| Subscription services | Declining | Flexibility fatigue |
| Short-term leasing | Stable | Urban markets only |
| Peer-to-peer rental | Growing | Secondary income appeal |
Changing attitudes toward car ownership, especially among younger generations, initially drove subscription growth—but the pendulum is swinging back toward ownership as consumers recognize long-term value.
Electric vehicle impact
EV depreciation reality
Electric vehicles present unique challenges in the used market:
| Metric | BEV | Petrol | Diesel |
|---|
| 36-month residual value | 26.2% | 38.5% | 34.1% |
| Buyer confidence | Low | High | Medium |
| Service complexity | High | Low | Medium |
| Charging infrastructure concern | Major | N/A | N/A |
EV market share by country
| Country | Used EV Penetration | Growth Rate |
|---|
| France (Ile-de-France) | 19.4% | +18.9% CAGR |
| Norway | 42.3% | +12.1% CAGR |
| Netherlands | 28.7% | +15.4% CAGR |
| Germany | 16.2% | +21.3% CAGR |
| UK | 14.8% | +19.7% CAGR |
Fuel type market share (france 2026
| Fuel Type | Market Share | Trend |
|---|
| Petrol | 44.26% | Declining slowly |
| Diesel | 31.4% | Declining faster |
| Hybrid | 12.8% | Growing |
| Electric | 8.2% | Growing rapidly |
| Other | 3.34% | Stable |
Government weight-based malus exemptions and expanding fast-charge corridors are accelerating EV adoption, particularly in major metropolitan areas.
Online sales channel growth
| Channel | Current Share | 2030 Projection | CAGR |
|---|
| Traditional dealership | 86.89% | 72% | -3.2% |
| Online platforms | 13.11% | 28% | +17.75% |
| Platform | Focus | Unique Value |
|---|
| Auto1 Group | B2B + B2C | Pan-European scale |
| Mobile.de | Marketplace | Largest inventory |
| AramisAuto | D2C | End-to-end digital |
| Cazoo | D2C | Delivery-first model |
| LaCentrale | Marketplace | French market leader |
Technology adoption by dealerships
| Technology | Adoption Rate | ROI Impact |
|---|
| AI inspection kiosks | 23% | +15% trust |
| Virtual showrooms | 41% | +22% engagement |
| Online financing | 67% | +35% conversion |
| Digital documentation | 78% | -40% admin time |
| Chatbot support | 52% | +18% lead capture |
For dealerships looking to modernize their digital presence, combining online tools with paid advertising strategies drives the best results.
Pricing strategies for 2026
Residual value trends
| Vehicle Category | RV Trend | Strategy |
|---|
| Premium SUVs | Stable | Hold pricing |
| Electric vehicles | Declining | Aggressive pricing |
| Economy cars | Rising | Premium positioning |
| Diesel | Declining | Quick turnover |
| Hybrids | Stable-Rising | Value messaging |
Pricing best practices
| Strategy | Implementation | Expected Impact |
|---|
| Dynamic pricing | AI-based daily adjustments | +8% margin |
| Competitive monitoring | Automated price tracking | +12% turn rate |
| Bundle offers | Service + warranty packages | +15% profit |
| Trade-in optimization | Fair market valuations | +20% loyalty |
| Seasonal adjustments | Demand-based pricing | +10% revenue |
Inventory management strategies
Optimal stock composition
| Category | Recommended % | Rationale |
|---|
| Vehicles 0-3 years | 25% | High margin, low volume |
| Vehicles 3-6 years | 35% | Sweet spot demand |
| Vehicles 6-10 years | 30% | Volume driver |
| Vehicles 10+ years | 10% | Accessibility market |
Sourcing channels
| Channel | Quality | Volume | Cost |
|---|
| Trade-ins | High | Medium | Low |
| Auctions | Variable | High | Medium |
| Fleet disposals | High | High | Medium |
| Private purchases | Variable | Low | Variable |
| OEM programs | Very High | Low | High |
Marketing strategies for used car dealers
Channel effectiveness 2026
| Channel | CPL Range | Lead Quality | Best For |
|---|
| Google Vehicle Ads | €5-15 | Very High | High-intent capture |
| Facebook Dynamic Ads | €3-10 | High | Awareness + retargeting |
| Automotive portals | €20-50 | Medium | Broad reach |
| Google Search | €30-80 | High | Brand + model specific |
| Display advertising | €40-100 | Low | Brand awareness |
Content strategy recommendations
| Content Type | Purpose | Frequency |
|---|
| Vehicle spotlights | Showcase inventory | Daily |
| Market updates | Build authority | Weekly |
| Buying guides | SEO + trust | Monthly |
| Customer stories | Social proof | Bi-weekly |
| Video walkarounds | Engagement | Per vehicle |
Combine content marketing with SEO strategies for sustainable organic traffic growth.
Key takeaways for dealerships
| Priority | Action | Timeline |
|---|
| High | Audit EV inventory pricing | This week |
| High | Implement dynamic pricing | This month |
| Medium | Launch digital inspection tools | This quarter |
| Medium | Expand 10+ year vehicle stock | This quarter |
| Low | Develop subscription exit strategy | This year |
2026 Success metrics
| KPI | Target | Measurement |
|---|
| Inventory turn rate | 8-10x annually | Monthly tracking |
| Days to sale | Under 45 days | Per vehicle |
| Gross margin | 12-15% | Per unit |
| Online lead share | Over 40% | Monthly |
| Customer satisfaction | 4.5/5 minimum | Post-sale survey |
Want to optimize your used car dealership’s marketing strategy? Contact our automotive specialists for a personalized consultation.
Sources: